How Long Has It Been Quiet? Updating a Volcano Hazard Forecast
A volcano that might, or might not, be done
On the small Caribbean island of Montserrat sits Soufrière Hills Volcano. It erupted violently starting in 1995, burying the former capital, Plymouth, and reshaping life on the island. Then, around 2010, it went quiet. By 2020 it had been silent for seven years; as I write this, it has been silent for thirteen.
Here is the uncomfortable question that silence raises: has the eruption actually ended, or is the volcano just resting? A lava dome is still perched at the summit. If it collapses, it sends a pyroclastic density current — a fast, hot avalanche of gas and rock — racing down the valleys. So the practical question for anyone living there is: over the next few years, what is the chance of such a flow, and where would it reach?
This post is about reproducing the statistical model that answers that question (from a 2020 paper by Spiller and colleagues), translating it from MATLAB to R, and then extending it from the 2020 state of knowledge to 2026. The headline turns out to be satisfyingly simple — but getting there taught me a lot about how a hazard forecast actually works.
Two questions, kept separate
The cleverest design choice in this model is that it splits one scary question into two independent ones:
- Will a flow happen at all? This is a question about time — modeled from the global record of how long dome-building eruptions last.
- If one happens, where does it go? This is a question about space — modeled from a physics simulator of how flows travel downhill.
Keeping these separate is not just tidy; it turns out to explain the entire main finding, as we’ll see.
The time question: when is an eruption “over”?
You might think you’d model this with a simple constant rate — “flows happen X times per year.” But that breaks immediately. If you fit such a rate to the active years, it predicts that seven years of total silence should be nearly impossible. Yet seven years of silence is exactly what happened. The data is telling you the premise is wrong: either the rate is far lower than it looked, or the eruption has genuinely ended.
The model handles this honestly by treating the eruption’s end-time as unknown — a quantity with its own probability distribution. The silence becomes evidence: the longer the quiet, the more probability shifts toward “it already ended.” Eruption durations worldwide follow a heavy-tailed distribution (a Generalized Pareto), which matters because it refuses to rule out the possibility that this eruption is simply one of the unusually long ones.
The space question: a fast stand-in for slow physics
Figuring out where a flow travels means running a simulator (TITAN2D) that solves the physics of the avalanche over the island’s real terrain. One run takes minutes to hours. You’d need thousands to cover every plausible flow size and direction — far too slow.
The fix is a Gaussian process emulator: you run the real simulator a few thousand times at well-chosen inputs, then fit a statistical surrogate that predicts the result anywhere else in milliseconds. This is the part of the project closest to my dissertation work, and it’s what makes the whole hazard map computable in about a minute.
Reproducing the paper
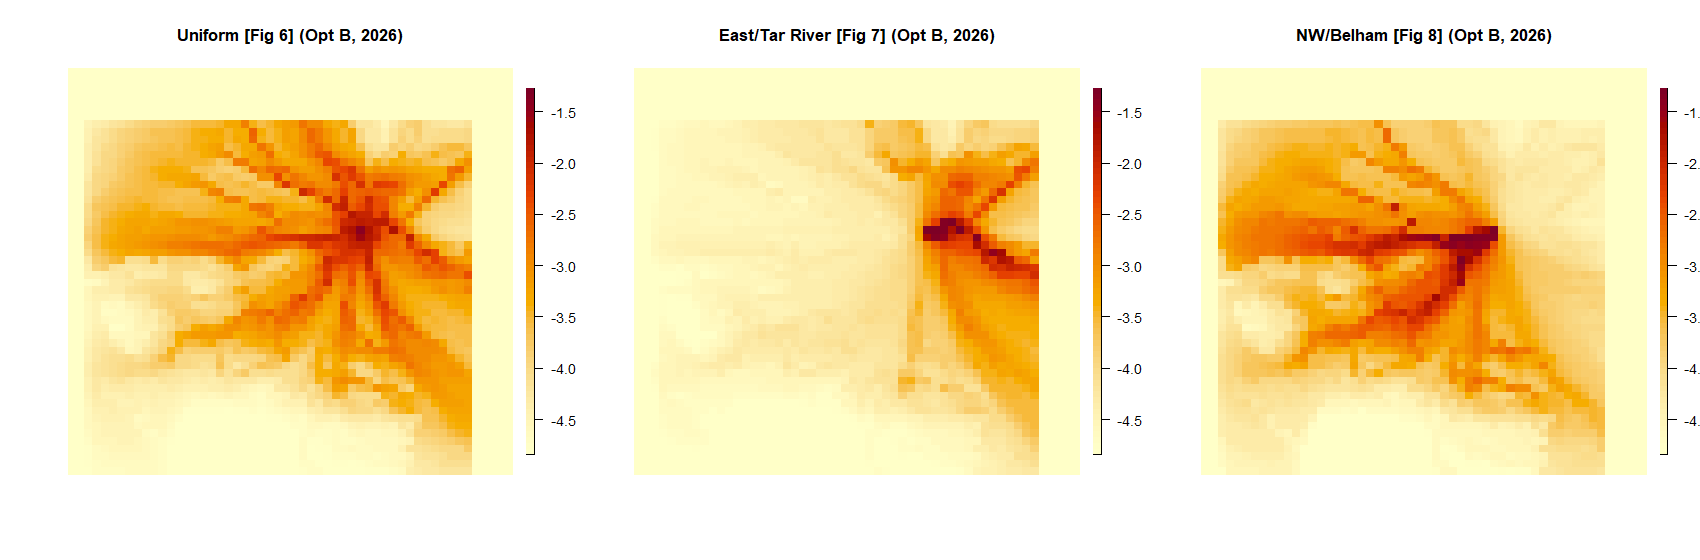
Before extending anything, I had to reproduce the original — the only honest way to know my translation was correct. The model’s hazard maps peaked at the same values the paper reported (a maximum inundation probability around 0.095 for the even-handed “flow could go any direction” case), and the forecast curves matched the paper’s peak almost exactly. That agreement was the green light.
What six more years of silence does
Here is the finding, and I find it genuinely elegant. Extending the model from 7 years of silence (2020) to 13 years (2026) reduces the inundation probability everywhere to about 42% of its 2020 value — and by nearly the same factor at every single location on the map.
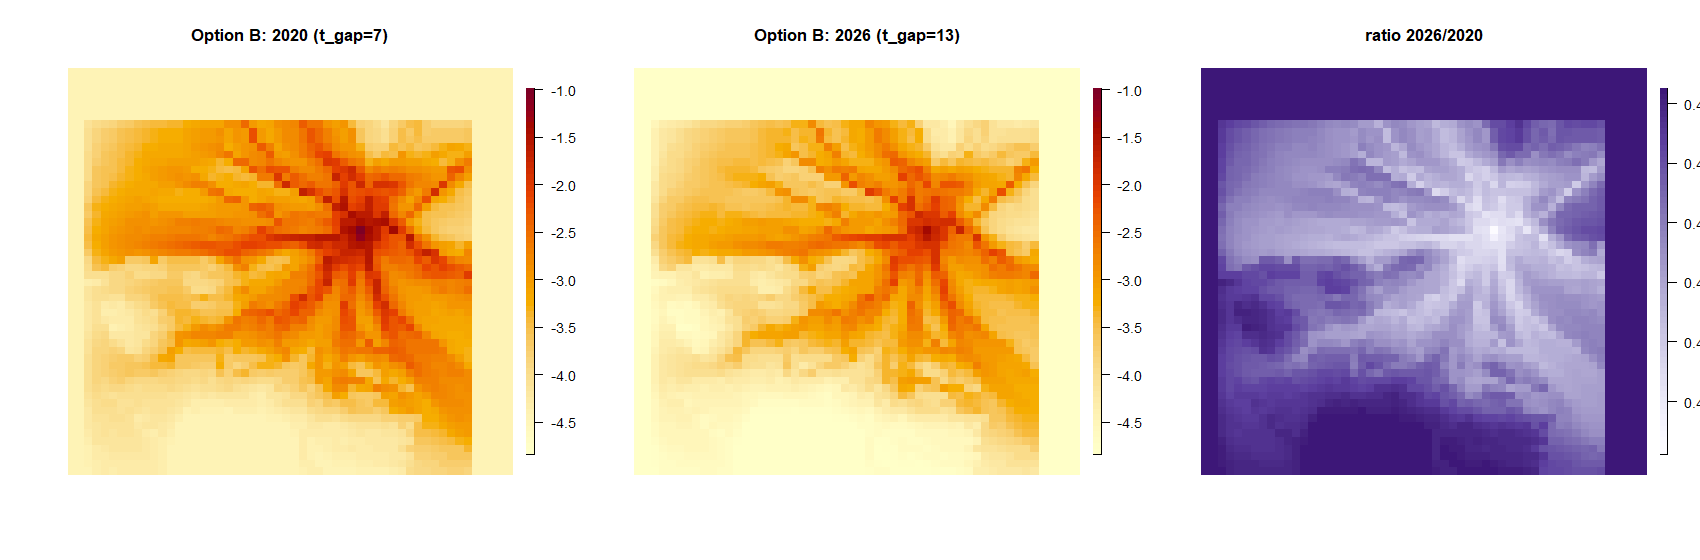
Why so uniform? This is where the two-questions split pays off. The extra silence changes only the time question — the overall chance that any flow happens — which is the same multiplier for every point on the map. It does not touch the space question of where a flow travels. So the spatial pattern of hazard is unchanged; only the overall level drops. On a log-color map this uniform dimming is nearly invisible to the eye, which is itself a lesson: the honest way to show this result is the single number (0.42) or the ratio map, not two side-by-side maps that look identical.
There’s a companion way to see the same thing. If you plot the forecast probability against the (unknown) flow rate, it rises then falls, peaking at a “worst-case” rate. Longer silence pushes that peak down and to the left: after thirteen quiet years, even a moderate flow rate looks inconsistent with the observed calm, so the most dangerous plausible rate is lower than it was.
A detail that mattered: what counts as “ongoing”?
One lesson worth sharing, because it nearly bit me. The global eruption catalog marks some eruptions as still ongoing — these are right-censored: we know only that they’ve lasted at least this long. Updating the data to 2026 means these ongoing eruptions should now be credited with more elapsed time.
The subtle part: deciding which eruptions count as ongoing uses one date (when the catalog was frozen), but deciding how long they’ve lasted uses a different date (the analysis date). Conflate the two and the model silently decides that zero eruptions are ongoing — which quietly corrupts everything downstream while still running without error. A wrong answer that looks plausible is far more dangerous than a crash. The habit that caught it: cross-checking one computation against an independent second one, and refusing to trust a number just because the code ran.
The bigger lesson
The scientific result here is clean but modest: six more years of quiet lower Montserrat’s dome-collapse hazard to about 42% of the 2020 assessment, uniformly, without changing which areas are most at risk. What I take away is less about volcanoes and more about method — that a good hazard model earns its trust by being reproducible, by separating the questions it answers so each piece can be understood on its own, and by being honest about uncertainty rather than papering over it. Those are the same virtues I want in the rest of my research.
This work was done with my advisor, Dr. Elaine Spiller, as part of my PhD research on Gaussian-process emulation for geophysical hazard assessment. The code is in R; the model was translated from the original MATLAB.